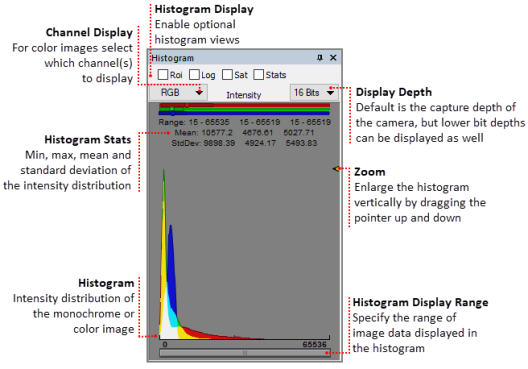
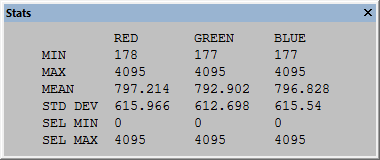
The Histogram Display shows the current intensity distribution for an image. In the case of RGB color images, multiple histograms are overlaid, one for each color. Areas where the histograms overlap are represented by the resultant color (i.e., red + green = yellow, red + blue = magenta and green + blue = cyan). The histogram reflects the bit depth of the image, a 16-bit image for example, consists of 65,535 possible intensity values. Statistics including: the range, mean and standard deviation are display above the histogram and may be displayed in a separate window by enabling Stats. The Histogram display may toggled on or off from the Status Bar.

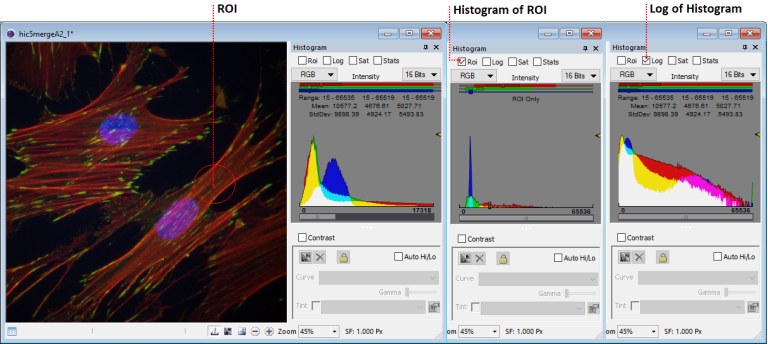
If the Region of Interest box is checked, the intensity of the ROI will be displayed in the Histogram.
When Log is checked, the Log of the Intensity Histogram is displayed.
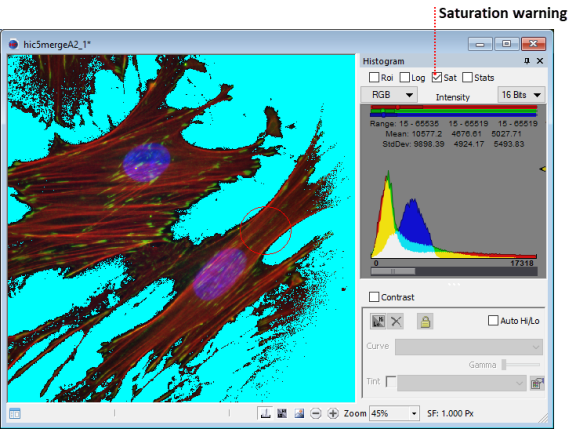
The Saturation function will display yellow representing a range of 4% from saturation. Red will be displayed when the image intensity reaches saturation. At the other end of the range when the image intensity is within 4% of zero (black) cyan is displayed. Blue will be displayed when zero is reached.
Displays the statistics in a separate window that may be undocked and enlarged.
Note: When using the ORCA-Flash4.0 series or the ImagEM X2 series cameras, the histogram statistics are reported in gray levels and electrons. This feature is only available when using the ORCA-Flash4.0 series and the ImagEM X2 series cameras. 
For color images, use the channel display to select which channel or channels to display in the histogram. The selected channel(s) are displayed in color and the histogram for the other channels is displayed as gray.
Displays the bit-depth of the image. Changing the display depth of the image does not affect the actual data, but can improve the viewing clarity of spreadsheet and histogram data in the display. It also affects the maximum slider value in the contrast dialog, identify dialog, and qualify dialog. The actual bit-depth of captured data can be controlled in Capture tab.
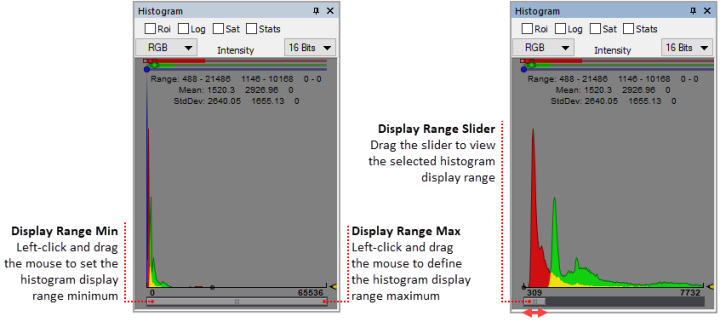
Define the range of values that are displayed in the histogram. Changing the display range of the histogram does not affect the image data, but can improve the viewing clarity of the histogram data that is displayed. When the intensity values of the image are concentrated within a given range (as shown below), details are lost in the limited view. The range is easily adjusted by grabbing either end and increasing or decreasing the display range. The min and max values of the display range are displayed below the histogram. Define the range of the histogram to display and then drag the slider to view specific areas of interest.
